

Image Details
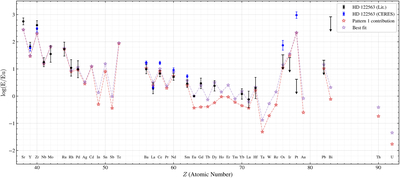
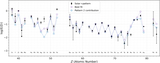
Caption: Figure 5.
Comparison of the best fit (violet stars) and contributions from Pattern 1 (red stars) with data on ﹩\mathrm{log}({\rm{E}}/{\rm{Eu}})﹩ for HD 122563. The best fit with a mixing parameter xEu = 0.37 is dominated by contributions from Pattern 1 for the light r-process and the second and third peak elements. Contributions from Pattern 2 are mostly limited to the Eu region. The best fit predicts a prominent third peak, with Os and Ir close to the upper limits from the literature data (black symbols; I. U. Roederer et al. 2012) but with Pt way above the upper limit. While the CERES data (blue symbols; L. Lombardo et al. 2022, 2025; A. Alencastro Puls et al. 2025) are consistent with the literature data on Y, Zr, and Ba to Sm, the former data on Os and Pt are significantly above the best fit. The large discrepancy in Pt between the CERES and literature data requires careful examination.
Other Images in This Article
Show More
Copyright and Terms & Conditions
© 2026. The Author(s). Published by the American Astronomical Society.

