

Image Details
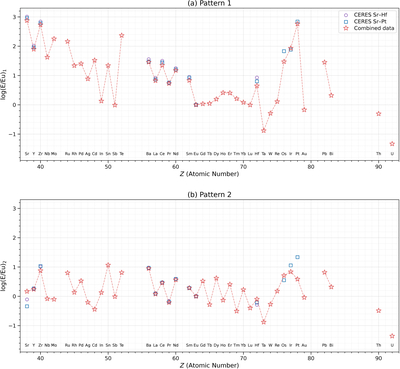
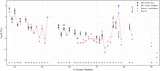
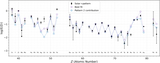
Caption: Figure 1.
Comparison of Patterns 1 and 2 for r-process production derived from the CERES data on Sr, Y, Zr, Ba to Eu, and Hf (violet circles), the CERES data including Os, Ir, and Pt (light blue squares), and the combined CERES and literature data (red stars).
Other Images in This Article
Show More
Copyright and Terms & Conditions
© 2026. The Author(s). Published by the American Astronomical Society.

Copyright ©
2026 Astronomy Image Explorer. All Rights Reserved.
