

Image Details
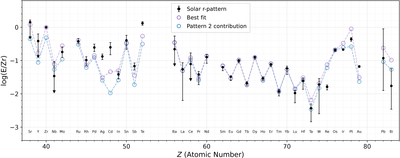
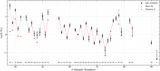
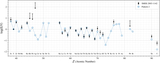
Caption: Figure 9.
Comparison of the best fit (violet circles) and contributions from Pattern 2 (light blue circles) with the solar r-process pattern (black symbols; S. Goriely 1999) in terms of ﹩\mathrm{log}({\rm{E}}/{\rm{Zr}})﹩. The best fit corresponds to a mixing parameter xZr = 0.51 and is dominated by contributions from Pattern 2 with those from Pattern 1 mostly limited to the light r-process elements, Te, and Pt. The large discrepancies between the best fit and the solar r-process pattern at Ag, Cd, Te, Re, and Au suggest that the parameters for these elements for Patterns 1 and 2 have large uncertainties.
Other Images in This Article
Show More
Copyright and Terms & Conditions
© 2026. The Author(s). Published by the American Astronomical Society.

