

Image Details
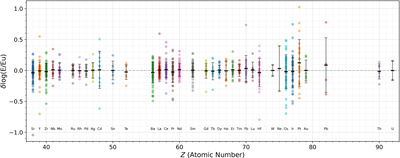
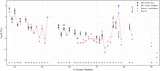
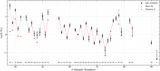
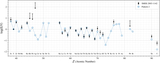
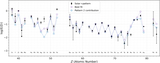
Caption: Figure 2.
The differences ﹩\delta \mathrm{log}({\rm{E}}/{\rm{Eu}})﹩ between the predicted and measured values for the combined sample. For each element, the thick horizontal bar indicates the mean ﹩\delta \mathrm{log}({\rm{E}}/{\rm{Eu}})﹩ across the sample and the error bar represents the 1σ scatter around the mean.
Other Images in This Article
Show More
Copyright and Terms & Conditions
© 2026. The Author(s). Published by the American Astronomical Society.

Copyright ©
2026 Astronomy Image Explorer. All Rights Reserved.
