

Image Details
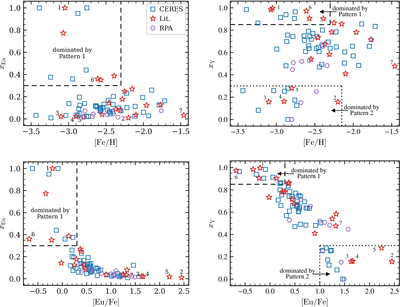
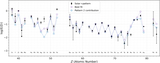
Caption: Figure 7.
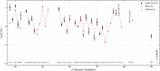
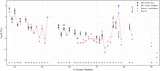
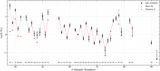
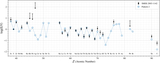
Mixing parameters xEu (left panels) and xY (right panels) as functions of [Fe/H] (upper panels) and [Eu/Fe] (lower panels). Light blue squares and red stars correspond to the CERES and literature sample, respectively. Violet circles represent the 10 stars in a recently published RPA sample (M. Racca et al. 2025), which is not used to derive Patterns 1 and 2, and therefore, provides an external test of our model. The fraction xEu (xY) of Eu (Y) contributed by Pattern 1 is calculated with Eu (Y) as the reference element. The upper left corner of each panel corresponds to stars dominated by Pattern 1. The lower left corner of the upper right panel and the lower right corner of the lower right panel correspond to stars dominated by Pattern 2. Labels 1–7 next to red star symbols correspond to J2140-1227, J2213-5137, CS 22892-052, CS 31082-001, J1521-3538, HD 122563, and HD 222925, respectively.
Other Images in This Article
Show More
Copyright and Terms & Conditions
© 2026. The Author(s). Published by the American Astronomical Society.

