

Image Details
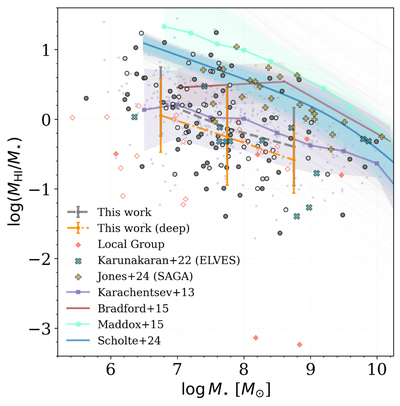
Caption: Figure 6.
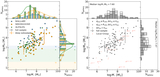
Atomic gas fraction (﹩\mathrm{log}{M}_{{\rm{H}}\,{\rm\small{I}}}/{M}_{\star }﹩) versus stellar mass for dwarf galaxies, comparing our Local Volume satellite sample with literature results. Our sample (circles and error bars) and Local Group gaseous dwarfs (light red diamonds) follow the same style as Figure 5, where symbol shading/fill indicates whether each dwarf is within R200, bound beyond R200, or unbound in projected phase space. Additional satellite comparison samples are shown from A. Karunakaran et al. (2022) (ELVES; crosses) and M. G. Jones et al. (2024) (SAGA; pluses), including only H I detections. Lines and shaded regions show the mean and 1σ scatter from field or mixed-environment comparison samples: I. D. Karachentsev et al. (2013) (purple; individual galaxies in light squares), J. D. Bradford et al. (2015) (brown), N. Maddox et al. (2015) (aqua), and D. Scholte et al. (2024) (blue; H I flux-limited); see Section 4.2.
Other Images in This Article
Show More
Copyright and Terms & Conditions
© 2026. The Author(s). Published by the American Astronomical Society.

