

Image Details
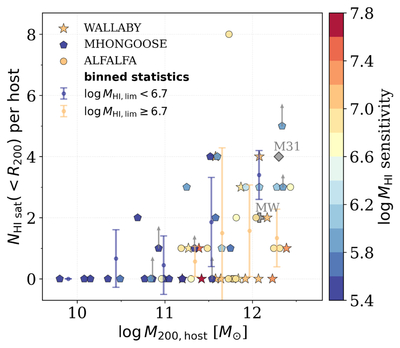
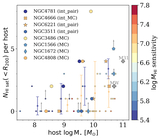
Caption: Figure 9.
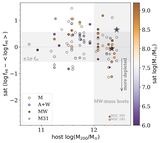
The number of H I–bearing satellite candidates within projected R200 versus the host halo mass. Points show individual hosts, colored by their H I sensitivity limits. Hosts with partial halo coverage (Table 1) are marked by upward arrows (four with Rcover/R200 = 70%–90% in full-size arrows, three with 90%−100% in half-size arrows). Error bars show binned means and 1σ scatter for two groups of our sample separated by median sensitivity: the deeper half with ﹩\mathrm{log}{M}_{{\rm{H}}\,{\rm\small{I}},{\rm{lim}}}\lt 6.7﹩ (in blue) and the rest with ﹩\mathrm{log}{M}_{{\rm{H}}\,{\rm\small{I}},{\rm{lim}}}\,\geqslant \,6.7﹩ (in yellow).
Other Images in This Article
Show More
Copyright and Terms & Conditions
© 2026. The Author(s). Published by the American Astronomical Society.

