

Image Details
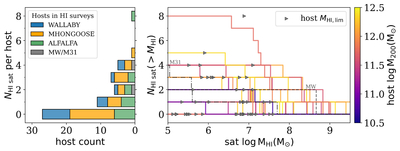
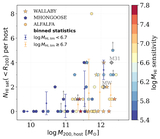
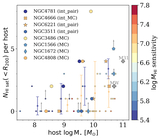
Caption: Figure 8.
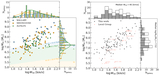
The abundance of H I–bearing satellites per host. Left: distribution of close satellite abundance (within projected R200) per host, colored by survey. This histogram combines a range of host masses; we show the NH I sat–Mhost relation separately in Figure 9. Right: the HIMF of the gaseous satellites per host, defined as the number of gaseous satellites above a given mass, colored by the host halo mass. Right-pointing triangles mark the host sensitivity limit ﹩{M}_{{\rm{H}}\,{\rm\small{I}},{\rm{lim}}}﹩ for typical dwarfs (W50 = 25 km s−1). The MW and M31 are shown in gray for reference.
Other Images in This Article
Show More
Copyright and Terms & Conditions
© 2026. The Author(s). Published by the American Astronomical Society.

Copyright ©
2026 Astronomy Image Explorer. All Rights Reserved.
