

Image Details
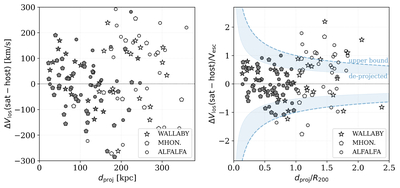
Caption: Figure 3.
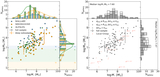
The spatial and kinematic separations between the gaseous dwarf galaxies and their hosts. Left: projected distance (dproj) and line-of-sight velocity separation (ΔVlos) are in physical units (Table A1); different symbols distinguish the H I data sources (Section 2). Right: the same quantities scaled by the host R200 and Vesc (Section 3.1). Blue curves show the point-mass escape velocity, with dashed lines denoting our satellite-unbound classification (Equation (5); taking RV, Rd = 1) and shaded regions showing the expected range under projection effects. Filled symbols in both panels highlight the “close” satellite candidates within the host projected R200.
Other Images in This Article
Show More
Copyright and Terms & Conditions
© 2026. The Author(s). Published by the American Astronomical Society.

