

Image Details
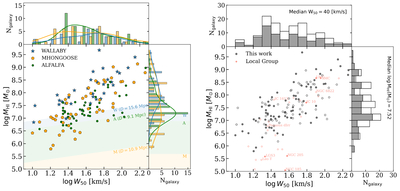
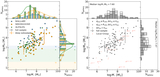
Caption: Figure 4.
The H I mass (MH I) versus velocity line width (W50) distribution for the gaseous dwarf sample (Table A1). Scatter points in the central panels represent individual H I–emitting dwarf galaxies; histograms in the corner panels show the marginal distribution. Left: symbols distinguish the H I surveys, and shadings in the central and right-hand (MH I marginal) panels show the corresponding H I mass sensitivities. Right: the full sample (circles; combining three surveys) compared with the Local Group gaseous dwarf population in the central panel (light red diamond symbols; M. E. Putman et al. 2021). Close satellites within the host galaxies’ projected R200 are shown with filled symbols as in Figure 3 or shaded histograms in the marginal panels.
Other Images in This Article
Show More
Copyright and Terms & Conditions
© 2026. The Author(s). Published by the American Astronomical Society.

