

Image Details
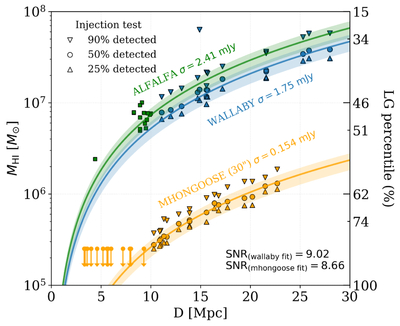
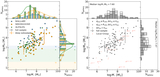
Caption: Figure 2.
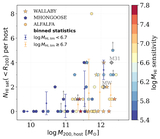
The H I sensitivity limits across surveys. Scatter points show the 25%, 50%, and 90% detectability thresholds (upward triangles, circles, downward triangles) from dwarf injection tests for WALLABY and MHONGOOSE and from empirical estimates of M. P. Haynes et al. (2011) for ALFALFA (squares). Downward arrows mark MHONGOOSE hosts with sensitivities deeper than the lowest-mass injection model (Appendix B.2). Lines and shaded regions show the sensitivity in Equation (3) at the best-fit SNRs for W50 = 25 and 15−35 km s−1, respectively. The right-hand y-axis gives the corresponding completeness relative to Local Group (LG) H I–bearing dwarfs (M. E. Putman et al. 2021).
Other Images in This Article
Show More
Copyright and Terms & Conditions
© 2026. The Author(s). Published by the American Astronomical Society.

