

Image Details
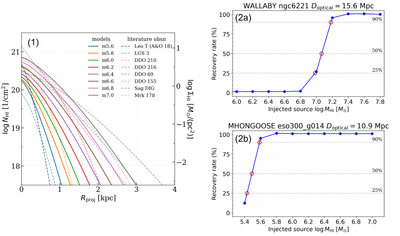
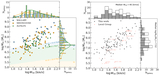
Caption: Figure B1.
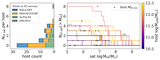
Key ingredients of our injection method for assessing the H I sensitivity. Panel (1): dwarf H I column density profiles as a function of radius. The model dwarfs (Equation (B1)) are shown in solid lines, while the observed low-mass dwarfs from the literature (MH I < 107 M⊙, from which the model parameters are derived) are shown in dashed lines (E. A. K. Adams & T. A. Oosterloo 2018; D. A. Hunter et al. 2021). Panels (2a) and (2b): the recovery rate as a function of injected dwarf mass. The WALLABY and MHONGOOSE example hosts shown here are at the median distance among each survey (Table 1). The red circles mark the MH I detectability thresholds at 25%, 50%, and 90% recovery rates.
Other Images in This Article
Show More
Copyright and Terms & Conditions
© 2026. The Author(s). Published by the American Astronomical Society.

