

Image Details
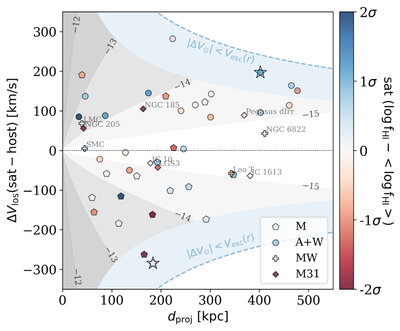
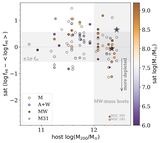
Caption: Figure 13.
Satellite–host spatial (dproj) and velocity (ΔVlos) separations (similar to Figure 3) for the satellite candidates of MW-mass hosts (﹩\mathrm{log}{M}_{200}/{M}_{\odot }\gt 12﹩; see Figure 7). The colors of the data points represent the degree of satellite gas depletion (Equation (6); see Section 4.3). Light blue shaded regions mark the escape velocity curves (Equation (4); see Section 3.5) for the full range of host halo masses shown here (﹩\mathrm{log}{M}_{200}/{M}_{\odot }\in [12,12.44]﹩). Gray-scale shadings show contours of estimated ram pressure strengths (annotating ﹩\mathrm{log}{P}_{{\rm{ram}}}﹩ values in dyne cm–2) based on an MW-like CGM model and simple deprojections (Equation (7); see Section 6). Two low-mass “outlier” satellites (also see Figure 7) are marked with open stars. Names of the MW and M31 gaseous satellites are annotated.
Other Images in This Article
Show More
Copyright and Terms & Conditions
© 2026. The Author(s). Published by the American Astronomical Society.

