

Image Details
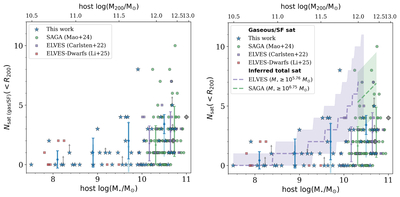
Caption: Figure 12.
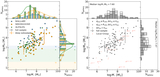
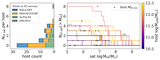
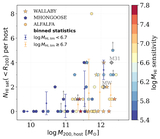
The number of dwarf satellites within the host’s projected R200 versus host mass, comparing multiple surveys (Section 5). Left: gas-rich satellites from this work (blue; arrows for hosts with partial coverage as in Figure 9) versus star-forming satellites from SAGA (green; Y.-Y. Mao et al. 2024), ELVES (purple; S. G. Carlsten et al. 2022), and ELVES-Dwarfs (red; J. Li et al. 2026). Points represent individual hosts, and error bars show binned averages and 1σ scatter. For our H I sample, darker and lighter error bars represent the deeper subsample (as in Figure 10) and full sample, respectively. The MW (plus symbol) and M31 (diamond symbol) are shown for reference. Host halo masses from P. Behroozi et al. (2019) are given on the top x-axis. Right: the gaseous/star-forming satellites as the left panel, with dashed lines and shaded regions showing the mean and ±1σ range of the total (star-forming + quenched) satellite counts from the optical surveys. For SAGA (green), the total counts are the observed, incompleteness-corrected averages (Table C1 in Y.-Y. Mao et al. 2024). For ELVES (purple), these are semianalytic predictions from S. Danieli et al. (2023) extended from spirals down to Magellanic-mass dwarf hosts (see J. Li et al. 2026).
Other Images in This Article
Show More
Copyright and Terms & Conditions
© 2026. The Author(s). Published by the American Astronomical Society.

