

Image Details
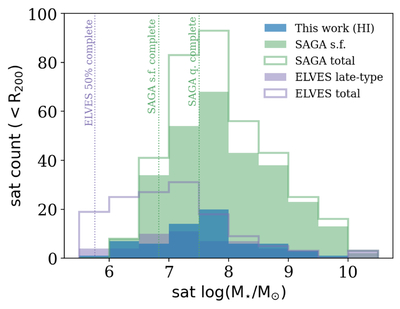
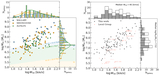
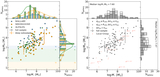
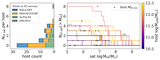
Caption: Figure 11.
Overview of the dwarf satellites within the host projected R200 from our H I sample and from optical surveys SAGA (green; Y.-Y. Mao et al. 2024) and ELVES (purple; S. G. Carlsten et al. 2022); see Section 5.1. Solid histograms count the star-forming (gas-rich) satellites from the optical (H I) surveys, while step histograms count the total (star-forming and quenched) satellites from the optical surveys. Dotted lines mark the ∼50% completeness limits in dwarf stellar mass: ﹩{M}_{\star ,\mathrm{lim}}\approx 1{0}^{7.5}\,{M}_{\odot }﹩ for SAGA quenched, ﹩{M}_{\star ,\mathrm{lim}}\approx 1{0}^{6.75}\,{M}_{\odot }﹩ for SAGA star-forming (Y.-Y. Mao et al. 2024), and ﹩{M}_{\star ,\mathrm{lim}}\approx 1{0}^{5.76}\,{M}_{\odot }﹩ for ELVES (S. G. Carlsten et al. 2022; S. Danieli et al. 2023).
Other Images in This Article
Show More
Copyright and Terms & Conditions
© 2026. The Author(s). Published by the American Astronomical Society.

