

Image Details
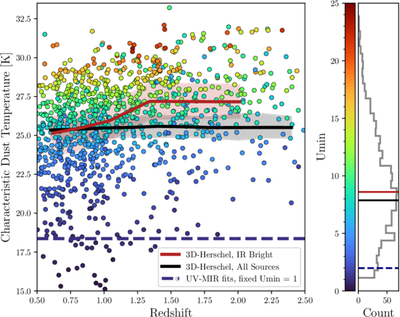
Caption: Figure 9.
Characteristic dust temperature (Td,char; Equation (3)) as a function of redshift for the IR-bright sample. Points are color-coded by ﹩{U}_{{\rm{\min }}}﹩, with its distribution shown as a histogram along the color bar. Median reference lines mark the fixed ﹩{U}_{{\rm{\min }}}﹩ fits (dashed navy; 18.4 K), the full 3D-Herschel mass-limited sample (black; 25.4 ± 2.1 K), and the IR-bright subsample (red; 25.7 ± 3.3 K).
Other Images in This Article
Copyright and Terms & Conditions
© 2026. The Author(s). Published by the American Astronomical Society.

Copyright ©
2026 Astronomy Image Explorer. All Rights Reserved.
