

Image Details
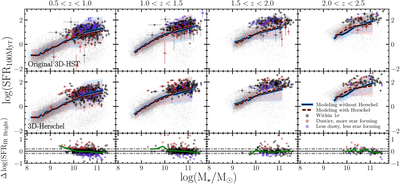
Caption: Figure 7.
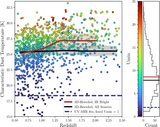
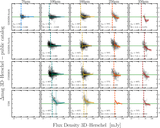
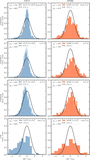
IR-bright population (circles) overplotted on the SFMS of the mass-limited sample, inferred from UV–MIR fits (blue line) and from Herschel-constrained fits (red dashed line). The top row shows SFRs and stellar masses from UV–MIR fits, whereas the middle row shows the same population from UV–FIR fits, and the bottom row shows SFR differences between the two sequences (Herschel—UV–MIR). Objects are color-coded as in Figure 5: significantly dustier and more star-forming (red) or less dusty and less star-forming (purple).
Other Images in This Article
Copyright and Terms & Conditions
© 2026. The Author(s). Published by the American Astronomical Society.

Copyright ©
2026 Astronomy Image Explorer. All Rights Reserved.
