

Image Details
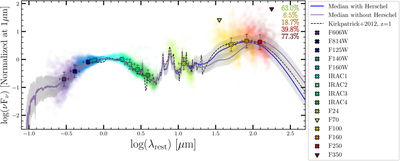
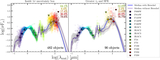
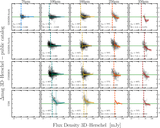
Caption: Figure 4.
Composite SEDs of the IR-bright sample from Prospector fits with Herschel FIR photometry added to the UV–MIR 3D-HST photometry (blue) compared to fits without Herschel (purple) and the z ∼ 1 star-forming template of A. Kirkpatrick et al. (2012) (dashed). Each SED is normalized by the average flux at rest frame 1 μm from the best-fit spectrum excluding Herschel photometry. The gray shaded region shows the ±1σ ensemble dispersion, computed as the median ± the median absolute deviation across all sources at each wavelength. Crosses and translucent circles show median and individual photometry (SNR > 3) respectively; inverted triangles are median upper limits for cases where >50% of the Herschel detections have SNR < 3. The percentage of upper limits in each Herschel band is listed in the upper right. Redshifts range from 0.5–2.5, with 294 of the 1118 sources having spectroscopic redshifts.
Other Images in This Article
Copyright and Terms & Conditions
© 2026. The Author(s). Published by the American Astronomical Society.

