

Image Details
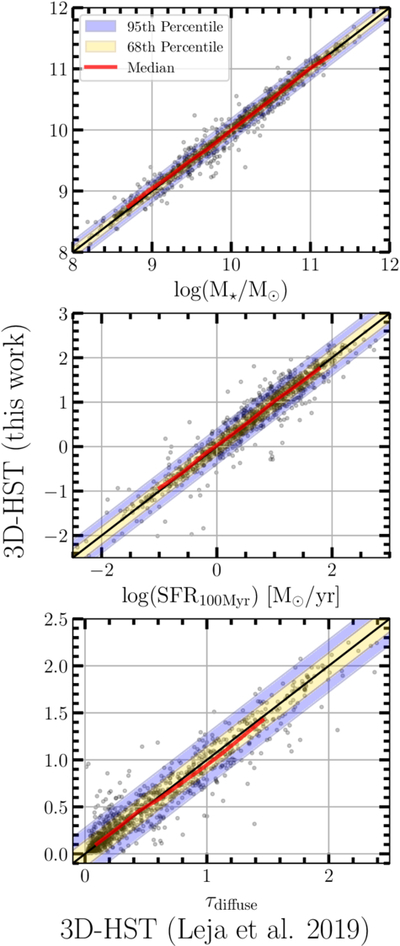
Caption: Figure 2.
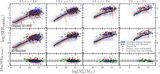
Comparison of posterior medians inferred from full Prospector fits of the adjusted 3D-HST catalog (J. Leja et al. 2019b; x-axis) versus our Prospector emulation on the publicly released 3D-HST catalog (y-axis). Panels show (top) stellar mass, (middle) SFR, and (bottom) diffuse dust attenuation. The one-to-one line is in black, and red lines show median offsets. The emulator reproduces direct-fit estimates within their statistical uncertainties.
Other Images in This Article
Copyright and Terms & Conditions
© 2026. The Author(s). Published by the American Astronomical Society.

Copyright ©
2026 Astronomy Image Explorer. All Rights Reserved.
