

Image Details
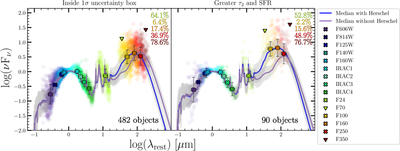
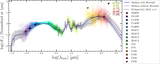
Caption: Figure 6.
Composite SEDs with (blue) and without (purple) Herschel photometry, normalized at 1 μm. The gray shaded region represents the ±1σ dispersion of the SED ensemble, computed as the median ± the median absolute deviation across all sources at each wavelength. The composites in the left panel are constructed from sources with diffuse dust and SFR offsets within their original 1σ uncertainties, while the right panel is created from IR-bright objects that are significantly dustier and more star-forming under the new constraints. The percentage of upper limits in each Herschel band is listed in the top right.
Other Images in This Article
Copyright and Terms & Conditions
© 2026. The Author(s). Published by the American Astronomical Society.

