

Image Details
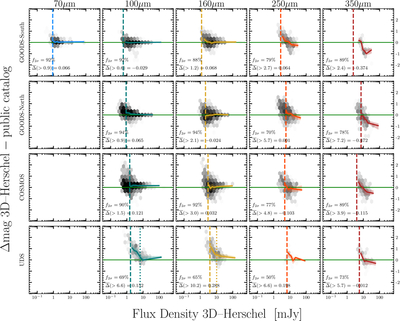
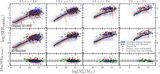
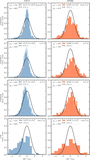
Caption: Figure A1.
Overall agreement of 3D-Herschel fluxes compared to published Herschel catalogs. The background color scale shows the logarithmic number density of sources in our sample. The dashed line indicates the median 3σ flux uncertainty from the original survey publications, whereas dotted lines indicate limits we infer herein for sources originally detected with Spitzer, as opposed to the forced photometry methods assumed in this study (Table 1). The mean offset for objects above the 3σ flux uncertainty (dashed line, or dotted if present) is listed in the lower left of each panel.
Other Images in This Article
Copyright and Terms & Conditions
© 2026. The Author(s). Published by the American Astronomical Society.

Copyright ©
2026 Astronomy Image Explorer. All Rights Reserved.
