

Image Details
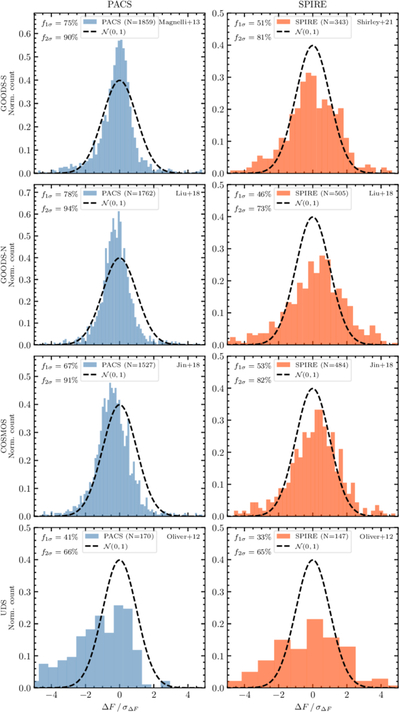
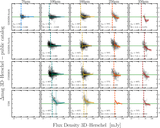
Caption: Figure A2.
Distributions of uncertainty-normalized flux residuals (Equation (A1)) for each field and instrument. Left column: PACS bands; right column: SPIRE bands. Rows correspond to GOODS-S, GOODS-N, COSMOS, and UDS from top to bottom. The dashed curve shows the unit Gaussian ﹩{ \mathcal N }(0,1)﹩ expected for perfectly Gaussian, well-calibrated uncertainties. The comparison catalog used in each panel is indicated in the upper right. The fractions f1σ and f2σ give the fraction of sources with ∣ΔF/σΔF∣ within 1 and 2, respectively.
Other Images in This Article
Copyright and Terms & Conditions
© 2026. The Author(s). Published by the American Astronomical Society.

Copyright ©
2026 Astronomy Image Explorer. All Rights Reserved.
