

Image Details
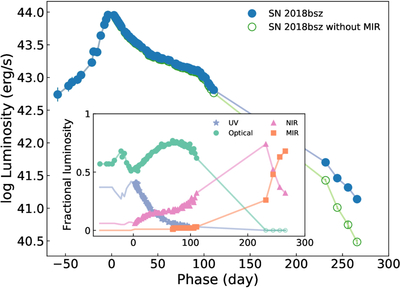
Caption: Figure C1.
The bolometric light curve of SN 2018bsz. The blue solid points show the light curve integrated over all bands as discussed in the text, while the empty green points show the integration excluding the MIR contribution. The inset panel shows the relative contribution of UV (uvw2, uvm2, uvw1), optical (U, B, g, c, V, r, o, i, z), NIR (J, H, Ks), and MIR (W1, W2).
Other Images in This Article
Show More
Copyright and Terms & Conditions
© 2026. The Author(s). Published by the American Astronomical Society.

Copyright ©
2026 Astronomy Image Explorer. All Rights Reserved.
