

Image Details
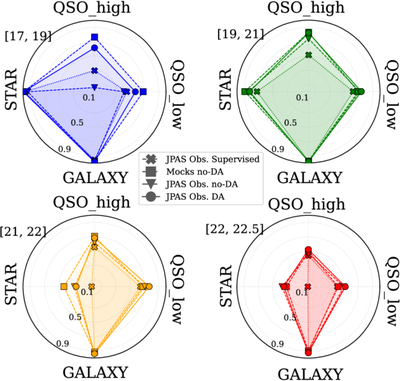
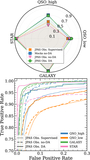
Caption: Figure 8.
Classwise F1 versus r-band magnitude cuts. Each polygon shows per-class F1 for a specific r-band selection (cuts indicated in the legend). Axes correspond to classes (QSO_high, QSO_low, GALAXY, STAR); the radius encodes F1 in [0, 1] with concentric gridlines for reference. Markers and linestyles match Figure 4. For each magnitude cut, the J-PAS-based regimes are tested on the J-PAS Observations test split, while the “mocks no-DA” pipeline is evaluated employing the mock test split. Because the J-PAS×DESI test set is comparatively small, some cuts leave few objects per class (e.g., only 11 QSO_high for 17 ≤ r < 19 and 54/28 STAR for 21 ≤ r < 22 and 22 < r ≤ 22.5), so apparent swings can be dominated by counting noise and should not be overinterpreted.
Other Images in This Article
Copyright and Terms & Conditions
© 2026. The Author(s). Published by the American Astronomical Society.

