

Image Details
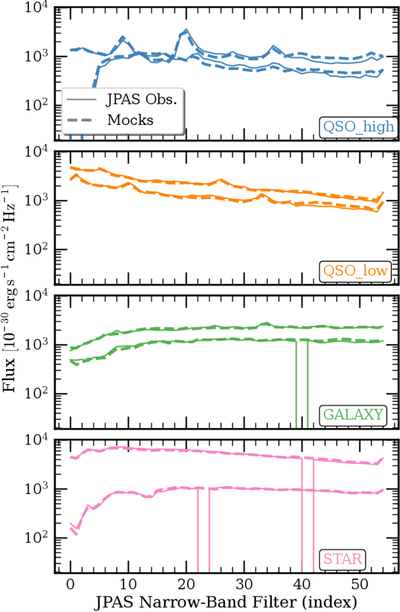
Caption: Figure 1.
Representative photometric SEDs, comparing J-PAS observations (solid curves) with DESI→J-PAS mocks (dashed curves). Each solid/dashed pair corresponds to a distinct individual object with a one-to-one mock counterpart (i.e., the dashed curve is the mock constructed for that same source); the multiple curves shown in each panel are therefore not averaged templates but separate objects plotted together for illustration. Panels correspond to different classes. Curves span the effective 55-band set after reliability masking (Section 2.2). For visual clarity, we display examples with i-band signal-to-noise ratio (S/N) >200; this high-S/N cut is used only for visualization and is not applied elsewhere in the analysis. Within each class, the plotted objects are selected from the subset passing this visualization-only S/N cut (randomly chosen from the eligible set). For legibility, we also omit error bars. We intentionally retain bands with missing flux measurements in J-PAS (visible as gaps) to reflect the real observational coverage.
Other Images in This Article
Copyright and Terms & Conditions
© 2026. The Author(s). Published by the American Astronomical Society.

