

Image Details
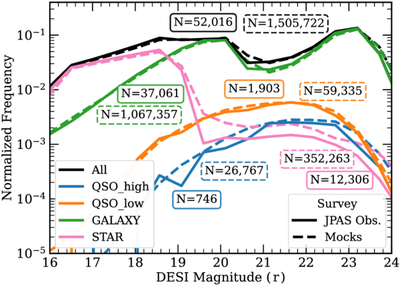
Caption: Figure 2.
Class balance in our two working datasets: full DESI→J-PAS mocks (source; dashed) versus the labeled J-PAS×DESI subset (target; solid). The y-axis shows the relative frequency per magnitude bin normalized by the total size of the mock catalog (≃1.5 × 10⁶ unique sources); consequently, curves appear on the same percentage scale and trace each other in shape even though absolute counts differ widely (NMocks ≫ NJ-PAS; see the total per-class counts in the annotated boxes). The figure includes all objects after our data curation (Section 2.2); no train/validation/test splits or magnitude cuts are applied here.
Other Images in This Article
Copyright and Terms & Conditions
© 2026. The Author(s). Published by the American Astronomical Society.

