

Image Details
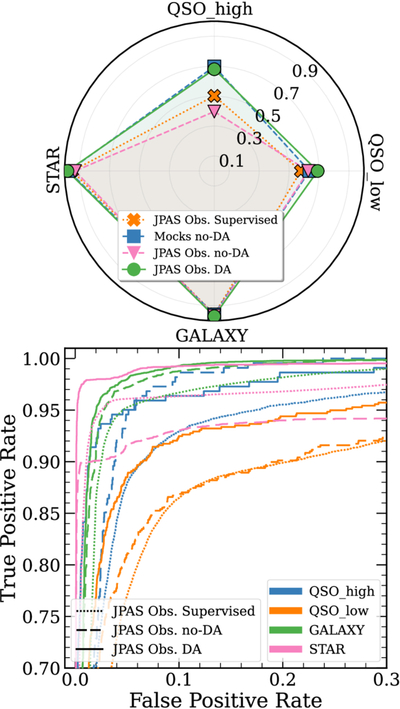
Caption: Figure 4.
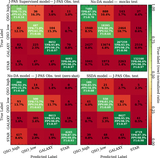
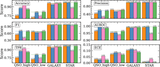
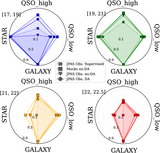
Per-class summary diagnostics. Top: F1 scores by class (radar plot) shown for all four regimes (different markers with distinct colors and linestyles). Bottom: per-class ROC curves and AUC values; the low-FPR region (left) is most relevant for building clean follow-up target lists. Both panels reflect the same trend seen in Figure 3: SSDA boosts the quasar subclasses while leaving GALAXY/STAR essentially saturated.
Other Images in This Article
Copyright and Terms & Conditions
© 2026. The Author(s). Published by the American Astronomical Society.

Copyright ©
2026 Astronomy Image Explorer. All Rights Reserved.
