

Image Details
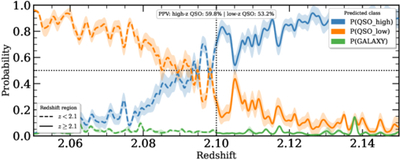
Caption: Figure 6.
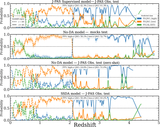
Zoom on the z ≃ 2.1 transition. Predicted probabilities P(QSO_high) (blue), P(QSO_low) (orange), and P(GALAXY) (green) in the narrow window 2.06 ≲ z ≲ 2.14, for the no-DA model on the high-statistics DESI→J-PAS mock training sample, which provides the dense sampling needed to resolve the crossover; linestyles and the dotted guidelines are as in Figure 5. The median P(QSO_high) climbs through 0.5 as z crosses 2.1 while P(QSO_low) symmetrically falls.
Other Images in This Article
Copyright and Terms & Conditions
© 2026. The Author(s). Published by the American Astronomical Society.

Copyright ©
2026 Astronomy Image Explorer. All Rights Reserved.
