

Image Details
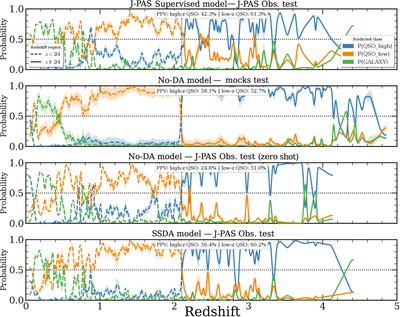
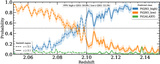
Caption: Figure 5.
Quasar class probabilities versus redshift across the four regimes (test sets). Each panel shows, as a function of spectroscopic redshift, the binned-median-predicted probabilities P(QSO_high) (blue), P(QSO_low) (orange), and P(GALAXY) (green); shaded bands show a ﹩\pm \frac{1}{3}\sigma ﹩ per-bin dispersion, and the STAR channel is omitted for clarity. Linestyle encodes the true redshift region: solid for z ≥ 2.1 (true QSO_high) and dashed for z < 2.1 (true QSO_low). From top to bottom: the supervised model baseline, the no-DA model evaluated in its own (mock) domain, the no-DA model transferred as zero-shot to J-PAS, and the SSDA model on J-PAS, each on its respective held-out test set. The vertical dotted line marks the z = 2.1 subclass split, and the horizontal dotted line p = 0.5; the inset quotes the precision (PPV) of each quasar subclass over the full test set.
Other Images in This Article
Copyright and Terms & Conditions
© 2026. The Author(s). Published by the American Astronomical Society.

