

Image Details
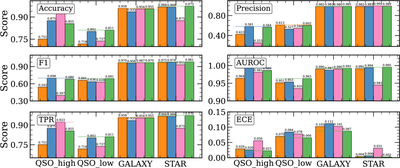
Caption: Figure 7.
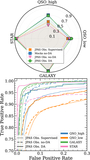
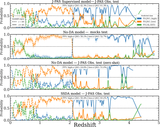
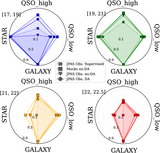
Per-class diagnostics across regimes. Panels on left the show, from top to bottom: accuracy, F1, TPR/recall. Panels on the right show, from top to bottom: precision/PPV, AUC, and ECE. Within each panel, bars are grouped by true class (QSO_high, QSO_low, GALAXY, STAR); values are printed above the bars, and dashed horizontal lines mark the per-class top-performance model. Colors are fixed across all panels and figures: orange = J-PAS supervised (evaluated on the J-PAS Observations test split), blue = Mocks no-DA in-domain (trained and evaluated on DESI→J-PAS mocks), pink = J-PAS no-DA (trained on mocks, evaluated zero-shot on the J-PAS Observations test split), and green = J-PAS SSDA (mock-pretrained encoder adapted on a small, labeled J-PAS set —15,597 objects, of which only 242 are QSO_high; evaluated on the J-PAS Observations test split).
Other Images in This Article
Copyright and Terms & Conditions
© 2026. The Author(s). Published by the American Astronomical Society.

