

Image Details
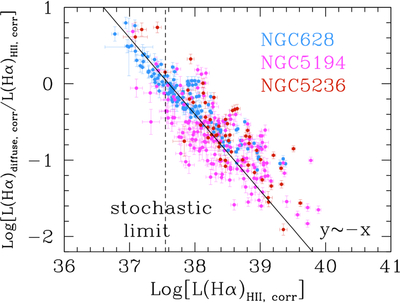
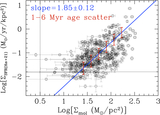
Caption: Figure 13.
The ratio of diffuse-to-H II region Hα emission for the sources in our sample, shown in different color symbols for the different galaxies (teal = NGC 628; magenta = NGC 5194; dark red = NGC 5236). Both the diffuse and H II region Hα have been corrected for dust attenuation, using the Hα/Paα recombination line ratio. The stochastic sampling limit is marked by the vertical dashed black line. The solid black line marks the y ∝ −x trend, in log–log scale, expected if the diffuse emission is roughly constant; this line is not a fit to the data.
Other Images in This Article

Show More
Copyright and Terms & Conditions
© 2026. The Author(s). Published by the American Astronomical Society.

Copyright ©
2026 Astronomy Image Explorer. All Rights Reserved.
