

Image Details
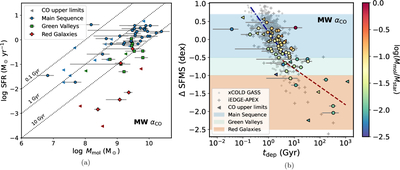
Caption: Figure 8.
(a) The SFR–Mmol relation across all 62 galaxies, using Hα-based SFR estimates and Mmol derived via a Galactic αCO. The dotted lines show constant molecular gas depletion times (tdep) of 0.1, 1, and 10 Gyr. (b) The derived tdep increases systematically as galaxies go from MS galaxies to GV galaxies to RGs, suggesting that low SFRs in quenched galaxies are mostly caused by suppressed SFE rather than the lack of molecular gas. The light gray points and pluses are from the xCOLD GASS survey (A. Saintonge et al. 2017) and the iEDGE APEX data (D. Colombo et al. 2025b), respectively, which align with an expected slope of −1 (blue dashed–dotted line). Our GV and RG sample reveals an increased tdep with a best-fit slope of −0.5 (red dashed line). The color–coded molecular-to-stellar mass ratio shows higher values in MS galaxies but remains similarly low across GV galaxies and RGs, implying a dominant SFE-driven quenching from the GV to RG populations.
Other Images in This Article
Show More
Copyright and Terms & Conditions
© 2026. The Author(s). Published by the American Astronomical Society.

