

Image Details
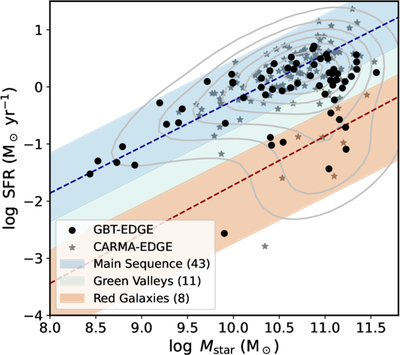
Caption: Figure 1.
The relation between global SFR and stellar mass (Mstar) for our GBT sample (black points; 62 galaxies), the CARMA sample (gray stars; A. D. Bolatto et al. 2017), and the full CALIFA sample (contours; S. F. Sánchez et al. 2016a). The blue (upper) and red (lower) dashed lines indicate best linear fits from M. Cano-Díaz et al. (2016) for the MS galaxies and RGs, respectively. The GBT-EDGE sample is representative of the z = 0 galaxy population with Mstar = 108.5−11.5 M⊙.
Other Images in This Article
Show More
Copyright and Terms & Conditions
© 2026. The Author(s). Published by the American Astronomical Society.

Copyright ©
2026 Astronomy Image Explorer. All Rights Reserved.
