

Image Details
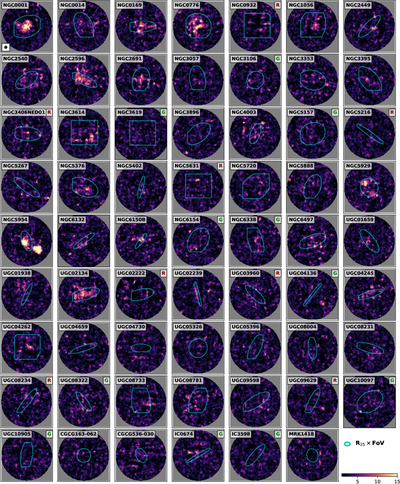
Caption: Figure 4.
The peak S/N maps of all 62 galaxies, integrating over a channel width of 90 km s−1 to highlight gas structures with line widths at that scale. GV galaxies and RGs are labeled by “G” and “R,” respectively, in the top right corner. The color scale (bottom right panel) ranges from S/N = 1 to 15. Each panel shows the entire GBT field of view of ﹩2\mathop{.}\limits^{{\rm{^{\prime} }}}5\times 2\mathop{.}\limits^{{\rm{^{\prime} }}}5﹩, and the common beam size of 8﹩\mathop{.}\limits^{{\unicode{x02033}}}﹩3 (∼2 kpc for our sample) is shown in the top left panel. The overlaid cyan contours indicate the intersection between each galaxy’s R25 radius and CALIFA’s field of view, which defines the area for computing galaxy-integrated quantities (Section 3).
Other Images in This Article
Show More
Copyright and Terms & Conditions
© 2026. The Author(s). Published by the American Astronomical Society.

