

Image Details
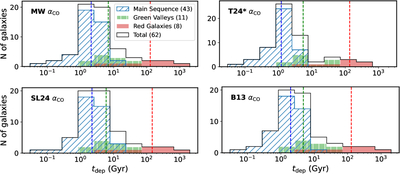
Caption: Figure 9.
Histograms of the derived gas depletion times under four different αCO treatments: constant MW value, a CO velocity dispersion-based prescription (T24*; Equation (10)), and two metallicity + stellar mass density–based prescriptions (B13 and SL24; Equations (8) and (9)). The vertical dashed lines represent the median tdep values for each galaxy population. All four prescriptions reveal distinct tdep distributions for the MS, GV, and RG groups, showing longer tdep in more quenched galaxies.
Other Images in This Article
Show More
Copyright and Terms & Conditions
© 2026. The Author(s). Published by the American Astronomical Society.

Copyright ©
2026 Astronomy Image Explorer. All Rights Reserved.
