

Image Details
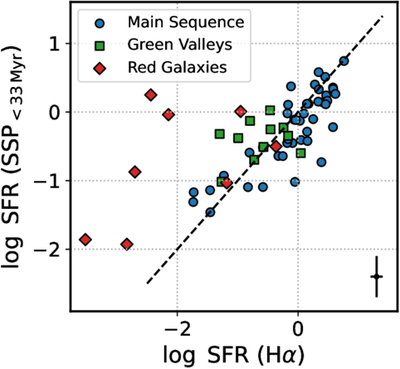
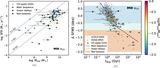
Caption: Figure 10.
Comparison between SFRs estimated via Hα (Section 3.2.1) and the SSP analysis. The dashed line indicates a one-to-one relation. For the MS and GV populations, SFRs inferred from Hα are consistent with those inferred from the SSP analysis with t < 33 Myr. For RGs, however, the Hα-based SFR generally provides better upper limits than using SSP. A typical error bar of σx = ±0.1 dex for SFR(Hα) and σy = ±0.3 dex for SFR(SSP) is shown in the lower right corner.
Other Images in This Article
Show More
Copyright and Terms & Conditions
© 2026. The Author(s). Published by the American Astronomical Society.

Copyright ©
2026 Astronomy Image Explorer. All Rights Reserved.
