

Image Details
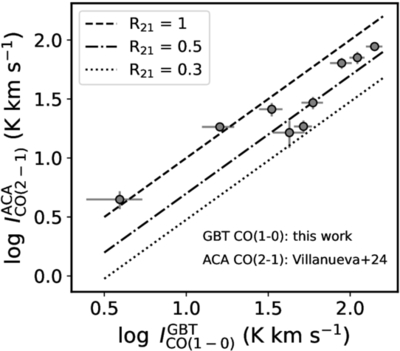
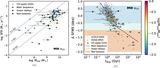
Caption: Figure 5.
Comparison of the GBT CO (1–0) integrated line fluxes with those from the ALMA ACA CO (2–1) data (V. Villanueva et al. 2024) for the nine galaxies that overlap between both samples. They show a CO (2–1)/(1–0) line ratio (R21) of 0.70 ± 0.27. Galaxies with the highest and lowest R21 tend to have higher uncertainties in the GBT data.
Other Images in This Article
Show More
Copyright and Terms & Conditions
© 2026. The Author(s). Published by the American Astronomical Society.

Copyright ©
2026 Astronomy Image Explorer. All Rights Reserved.
