

Image Details
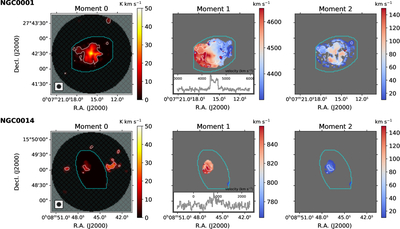
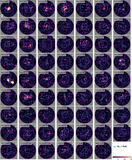
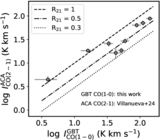
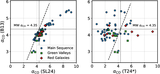
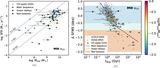
Caption: Figure 6.
Examples of the moment 0 (left), 1 (middle), and 2 (right) maps, based on Hα + CO-dilated masking (see Section 3.1). The white contours show S/N > 5 based on the moment 0 maps. The common beam size and cyan contours are the same as in Figure 4. Some galaxies show high-quality detection in moment 0 and clear velocity gradients indicative of galaxy rotation (e.g., top row, NGC 0001), while some galaxies show spurious emission outside their R25 radii due to baseline variations, leading to high flux uncertainties (e.g., bottom row, NGC 0014). Our analysis only includes regions within the R25 radii, as enclosed by the cyan contours. The integrated spectra of S/N > 5 regions within the cyan contours are inserted into the middle panel.
Other Images in This Article
Show More
Copyright and Terms & Conditions
© 2026. The Author(s). Published by the American Astronomical Society.

