

Image Details
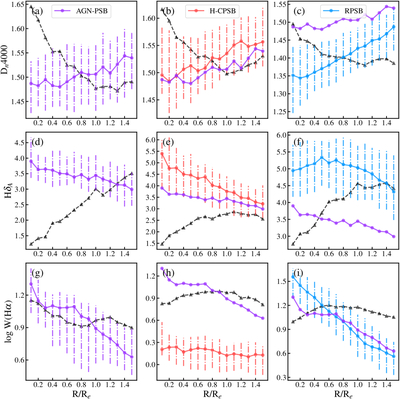
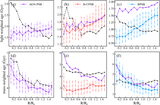
Caption: Figure 9.
The median radial profiles of Dn4000 (top row), HδA (middle row), and W(Hα) (bottom row) as a function of radius for AGN-PSBs (left column; purple solid lines), H-CPSBs (middle column; red solid lines), RPSBs (right column; blue solid lines), and their control samples (black dashed lines). The error bars show the 30th–70th percentiles of the distributions for the PSB subtypes. For direct comparison, the median gradient of AGN-PSBs is overlaid in the middle and right columns.
Other Images in This Article
Show More
Copyright and Terms & Conditions
© 2026. The Author(s). Published by the American Astronomical Society.

Copyright ©
2026 Astronomy Image Explorer. All Rights Reserved.
