

Image Details
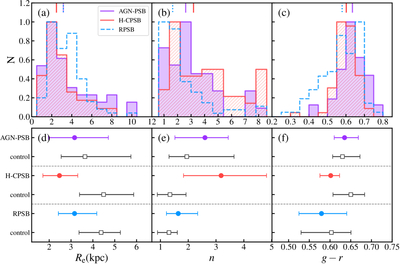
Caption: Figure 8.
Distributions of global properties for H-CPSBs (red), RPSBs (blue), and AGN-PSBs (purple). The top row shows histograms of Re (panel (a)), the Sérsic index (panel (b)), and g − r (panel (c)). Vertical lines at the top of each panel mark the medians of each distribution. The bottom row compares each PSB subtype with its control sample in Re (panel (d)), the Sérsic index (panel e), and g − r color (panel (f)). The colored solid circles and black open squares denote the medians of the PSB subtypes and their controls, respectively. The error bars indicate the 30th to 70th percentiles of the distributions.
Other Images in This Article
Show More
Copyright and Terms & Conditions
© 2026. The Author(s). Published by the American Astronomical Society.

