

Image Details
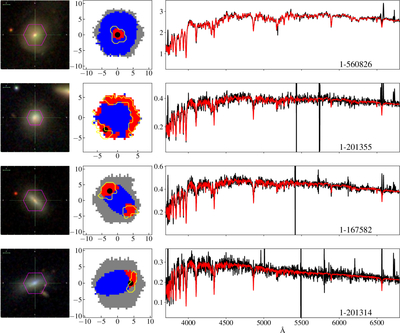
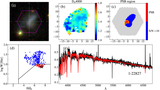
Caption: Figure 2.
Examples of four PSBs in the MaNGA survey. The left panel shows the SDSS g, r, i image. The middle panel colors PSB spaxels in red, non-PSB spaxels with median spectral S/N per pixel > 10 in blue, and spaxels with lower S/N in gray; the overlaid yellow lines denote the PSB regions identified by Z. Cheng et al. (2024). The right-hand panel shows the spectrum at the location indicated by the black dot in the middle panel, with the observed spectrum shown in black and the best-fit stellar continuum model derived from the MaNGA DAP in red. The MaNGA ID of the example galaxy is labeled at the bottom right of each row. The figure is organized from top to bottom as follows: a CPSB, a face-on RPSB, an edge-on RPSB, and an IPSB system. As expected, the PSB regions selected by us basically overlap with Z. Cheng et al. (2024).
Other Images in This Article
Show More
Copyright and Terms & Conditions
© 2026. The Author(s). Published by the American Astronomical Society.

