

Image Details
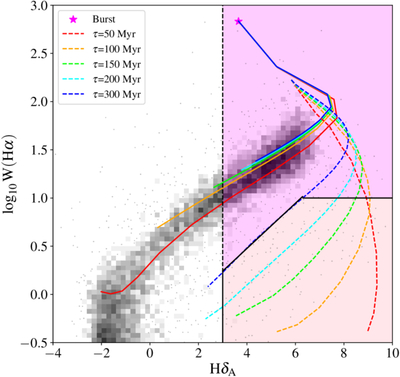
Caption: Figure 1.
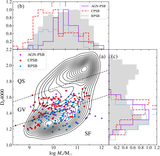
The relationship between the Hδ absorption line and the Hα emission-line equivalent width for a sample of galaxies from the MaNGA DAP catalog, overlaid with the toy model evolutionary tracks. The solid tracks correspond to exponentially declining SFHs with e-folding timescales ranging from τ = 0.5 Gyr (red) to τ = 5 Gyr (blue). The dashed tracks correspond to models featuring an extra SB at 6.5 Gyr, followed by a star formation truncation, with the e-folding timescales specified in the legend. All the models have a common youngest point marked by the magenta star, and they evolve toward the bottom-left corner over time. The pink-shaded area denotes the traditional PSB region (Y.-M. Chen et al. 2019), while the magenta-shaded region corresponds to the AGN-PSB region.
Other Images in This Article
Show More
Copyright and Terms & Conditions
© 2026. The Author(s). Published by the American Astronomical Society.

