

Image Details
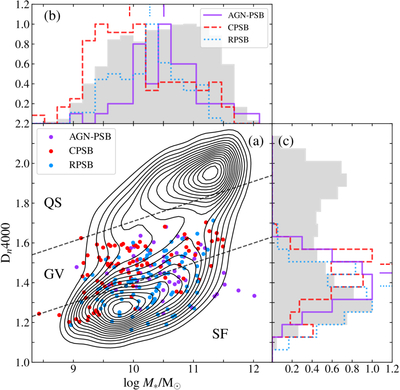
Caption: Figure 5.
The distribution of the three PSB subtypes on the global Dn4000–stellar mass relation. The background contours represent the full MaNGA sample, and the two dashed lines divide the galaxies into SF, GV, and quiescent-sequence (QS) galaxies. The lower dashed line approximates the upper boundary of the SF main sequence (at the ∼1σ scatter level), while the upper dashed line marks the lower boundary of the QS. AGN-PSBs, CPSBs, and RPSBs are overlaid in purple, red, and blue, respectively. The top and right histograms show distributions of the stellar mass and global Dn4000, respectively. The gray-shaded histograms represent the full MaNGA sample. Each distribution is normalized to its peak value for clear comparison, and the vertical lines at the top of these panels mark the medians of these distributions.
Other Images in This Article
Show More
Copyright and Terms & Conditions
© 2026. The Author(s). Published by the American Astronomical Society.

