

Image Details
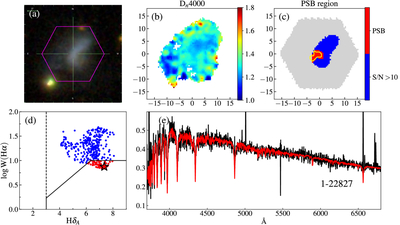
Caption: Figure 7.
An example of an L-CPSB galaxy with ﹩\mathrm{log}({M}_{* }/{M}_{\odot })=9.37﹩. Panel (a) displays the SDSS g, r, i image. Panel (b) shows the Dn4000 map, where bluer colors indicate smaller values and redder colors indicate larger values, ranging from 1.0 to 1.8. Panel (c) displays PSB spaxels in red, spaxels of median spectral S/N > 10 per pixel in blue, lower-S/N spaxels in gray, and outlines the PSB region defined by Z. Cheng et al. (2024) in yellow. Panel (d) presents the W(Hα)–HδA diagram, where the central spaxel is marked by a red star, PSB spaxels are in red, and other spaxels with median spectral S/N per pixel >10 are in blue. Panel (e) shows the central spectrum, with the observed flux in black and the best-fit stellar continuum model in red. The MaNGA ID of the galaxy is labeled at the bottom right.
Other Images in This Article
Show More
Copyright and Terms & Conditions
© 2026. The Author(s). Published by the American Astronomical Society.

