

Image Details
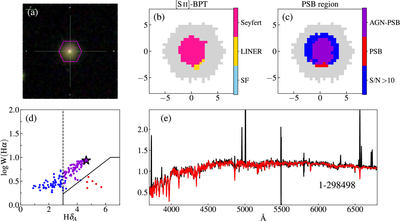
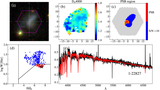
Caption: Figure 3.
An example of an AGN-PSB galaxy. Panel (a) displays the SDSS g, r, i image. Panel (b) displays the spatially resolved [S II]-BPT diagram, with Seyfert spaxels in pink, LINER spaxels in yellow, and SF spaxels in blue. Panel (c) highlights the spatial distribution of spaxels: AGN-PSB spaxels in purple, traditional PSB spaxels in red, spaxels of median spectral S/N > 10 per pixel in blue, and lower-S/N spaxels in gray. Panel (d) presents the W(Hα)–HδA correlation, where the central spaxel is marked by a star, AGN-PSB spaxels are in purple, traditional PSB spaxels are in red, and other spaxels with median spectral S/N per pixel >10 are in blue. Panel (e) shows the central spectrum in black, with the best-fit stellar continuum model from the MaNGA DAP overplotted in red. The MaNGA ID of the galaxy is labeled at the bottom right.
Other Images in This Article
Show More
Copyright and Terms & Conditions
© 2026. The Author(s). Published by the American Astronomical Society.

