

Image Details
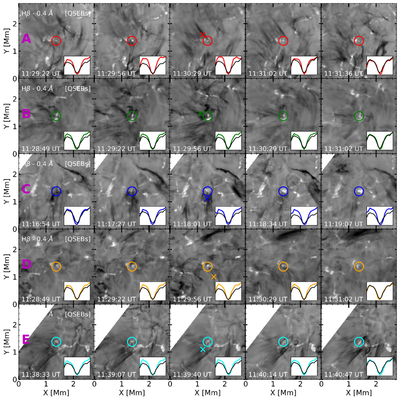
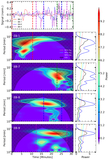
Caption: Figure 11.
Same as Figure 10, but for five QSEB-associated spicule events observed in the Hβ−0.4 Å wing. The Hβ spectral profiles of the spicule locations marked by crosses are shown in the right panel of Figure 12. The inset profiles correspond to the QSEB locations and display the characteristic, although generally weaker, wing-enhanced emission signatures compared to classical EBs.
Other Images in This Article
Show More
Copyright and Terms & Conditions
© 2026. The Author(s). Published by the American Astronomical Society.

Copyright ©
2026 Astronomy Image Explorer. All Rights Reserved.
