

Image Details
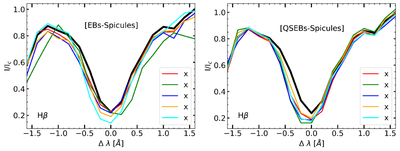
Caption: Figure 12.
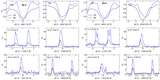
Normalized Hβ spectral profiles of the spicule associated with the EB and QSEB events shown in Figures 10 and 11. The left panel shows the spectra extracted at the locations marked by crosses in the EB-associated events, while the right panel shows the corresponding spectra for the QSEB-associated events. The black curves represent the average quiet-Sun profile. The red- and blueshifted absorption signatures are characteristic of RREs and RBEs, which are commonly interpreted as on-disk counterparts of spicules.
Other Images in This Article
Show More
Copyright and Terms & Conditions
© 2026. The Author(s). Published by the American Astronomical Society.

Copyright ©
2026 Astronomy Image Explorer. All Rights Reserved.
