

Image Details
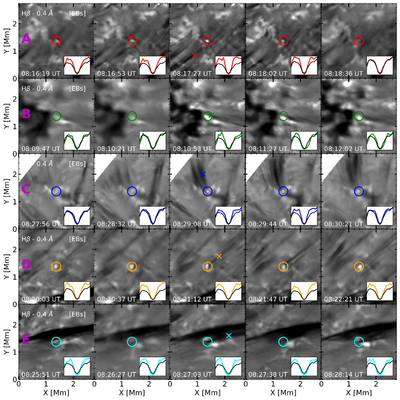
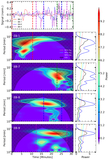
Caption: Figure 10.
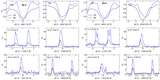
Representative examples showing image sequences that illustrate the temporal evolution of five EB-associated spicule events (rows A–E) observed in the Hβ−0.4 Å wing. Colored circles mark the locations of the EBs, while the corresponding crosses indicate the positions of the associated spicules, whose Hβ spectral profiles are shown in the left panel of Figure 12. The displayed images are separated by two intermediate frames. The inset profiles display the normalized Hβ spectra extracted at the EB locations, together with the average quiet-Sun profile (black curve). The EB spectra exhibit the characteristic wing-enhanced emission signatures. The image sequences suggest a temporal and spatial association between some EBs and appearance of spicules whose apparent footpoints coincide with the EB locations.
Other Images in This Article
Show More
Copyright and Terms & Conditions
© 2026. The Author(s). Published by the American Astronomical Society.

