

Image Details
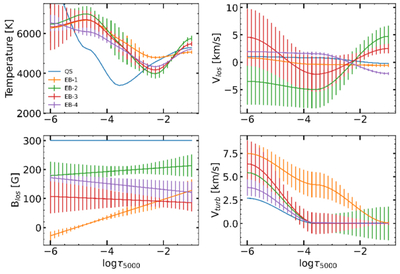
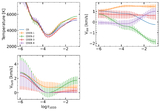
Caption: Figure 7.
The upper panels show the comparison of temperature and VLOS, whereas the lower panels represent the BLOS and Vturb stratification as a function of optical depth for four EBs, labeled as 1, 2, 3, and 4 in Figure 1, along with the QS reference. These inferred parameters are obtained from STiC inversions of the full Stokes profiles of the Ca II 8542 Å spectral line. The vertical error bars represent the 1σ uncertainties of the derived parameters, estimated using a Monte Carlo approach by perturbing the model atmosphere and repeating the inversions 500 times. The enhanced magnitude in T with respect to QS profile indicates localized heating in the lower chromosphere associated with the occurrence of the EBs.
Other Images in This Article
Show More
Copyright and Terms & Conditions
© 2026. The Author(s). Published by the American Astronomical Society.

