

Image Details
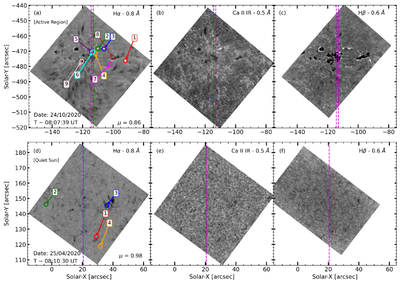
Caption: Figure 1.
The upper panel shows the chromosphere of the active region (Dataset 1) as observed in the blue wings of Hα (Hα −0.8 Å), Ca II IR (Ca II IR −0.5 Å), and Hβ (Hβ −0.6 Å). The lower panel presents the quiet-Sun (Dataset 2) chromosphere observed in the same spectral line wings. The magenta vertical line indicates the IRIS slit coverage. The colored labels in both the upper and lower panels mark the locations of the EBs and QSEBs studied in this work in detail.
Other Images in This Article
Show More
Copyright and Terms & Conditions
© 2026. The Author(s). Published by the American Astronomical Society.

Copyright ©
2026 Astronomy Image Explorer. All Rights Reserved.
